THE OCTOBER SOLAR STORM

THE OCTOBER SOLAR STORM

There appears to be a correspondence between the magnitude of magnetic disturbance that results from an extreme solar storm and the magnitude of apparently artificial ELF-VLF pulse data that has been previously recorded by Clifford Carnicom in the paper titled MAGNETICS, AEROSOLS & VLF (dated April 13, 2003). This indicates that any artificially generated pulsed data that has been recorded by this same magnetometer, as is shown in this paper, may also be acting on a global level. The role of the aerosols and the HAARP facility and the propagation of ELF-VLF energy, as is referenced in the previous Carnicom paper referenced above should also be a consideration in the comparison which is made in this work. 
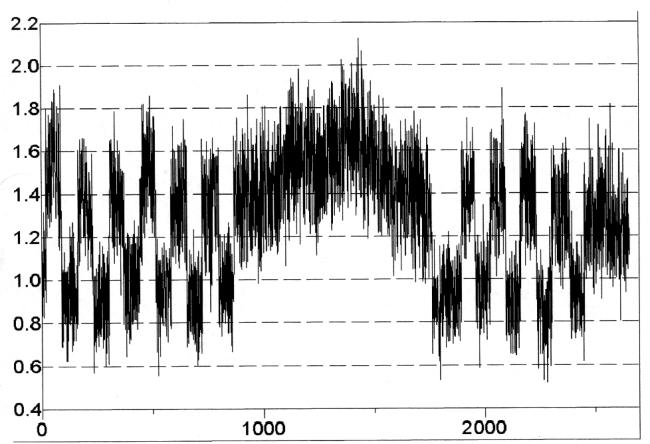
A graph attached to this page showing the magnitude of the magnetic disturbance captured and described above is compared to the graph of the anomalous magnetometer data recorded on April 5, 2003 in the aforementioned paper MAGNETICS, AEROSOLS & VLF. It will be noted that the magnitude of the pulsed and apparently artificial data is on the same order as that which results from the extreme solar storm recorded.
POSITIVE ELF SPECTRUM IDENTIFICATION

POSITIVE ELF SPECTRUM IDENTIFICATION

The spectrum of Extremely Low Frequency (ELF) signals has now been identified at multiples of 4Hz with the use of a digital spectrum analyzer/oscilloscope. The graph presented on this page was obtained with several significant modifications to the ELF circuit that has been described in the past few Carnicom papers, namely the paper titled ELF CIRCUIT DESIGN (dated January 26, 2003) with modifications that are discussed here and will be described further in a future paper. It was observed that the power of the signal being received is clearly of artificial origin and occurs at multiples of 4Hz. These frequencies occur in the range of the primary electromagnetic activity of the human brain. Research is currently underway to determine the direction (and eventual location) of the signals that are being generated and to which the populace is subject. Additional information on the directional parallel resonant loop antenna and the additional amplifier circuit will be forthcoming. It is requested that citizens across the nation and/or globe construct the circuit as it has been developed to assist in determining the origin of the signals through triangulation. Modifications for further enhancement are also welcomed.
A THIRD PATTERN OBSERVED : VERY LOW FREQUENCY PULSE SWITCHING

A THIRD PATTERN OBSERVED : VERY LOW FREQUENCY PULSE SWITCHING

A third significant pattern in the Extremely Low Frequency (ELF) to Very LOW Frequency (VLF) portion of the electromagnetic spectrum has now been observed and recorded. The pattern is one of a series of higher frequencies followed by a series of lower frequencies, with a period of approximately 60-100 seconds for each group of pulses. There is no known local or residential origin for these signals. The current VLF observations are significant in that they are not continuously occurring; three segments of approximately 15 minutes duration were observed in Santa Fe, New Mexico on March 1, 2001. The switching and pulse nature of the observations abruptly ceases and starts, as is shown in graphs on this page. There is no gradual transition between the different phases, and the variation in frequencies appears to be the direct result of a constructed modulation system.
CHACO CANYON NATIONAL PARK : 10 SECOND ELF PULSE OBSERVED

CHACO CANYON NATIONAL PARK : 10 SECOND ELF PULSE OBSERVED

A second significant Extremely Low Frequency (ELF) pattern has been observed in data which has been collected at two different locations approximately 140 miles apart in New Mexico. This pattern is that of what appears to be pulsed ELF data occurring at a definite period of 10 seconds. This pattern is in addition to the previously identified pattern of geometric multiples of 4Hz. The previous pattern is primarily that of frequency structure; the current attention is devoted to the time structure of the signals that are becoming evident. Graphs of the captured periodic data is presented on this page, as raw data, digital filtered data to eliminate noise, and spectral analysis of the filtered data. The periodic component of 10 seconds is dominant and prominent in all analyses. These findings combined (geometric multiples of frequencies with a periodic component) strong suggest the existence of modulated ELF data, i.e., the transmission of signals with inherent intelligence. A description of the techniques used to capture this data is presented here, which includes using a human antenna. It bears repeating that the ELF frequencies that have been measured and detected fall within the same range as foes the primary electromagnetic energy of the human brain. Those with expertise in the electrical engineering fields are encouraged to assist in the research that is required to further analyze these results.
ELF FREQUENCY IDENTIFICATION

ELF FREQUENCY IDENTIFICATION

Graphs are presented on this page showing the detected ELF (Extremely Low Frequencies) frequencies using the ELF-LF circuit tester devised in the previous Carnicom paper ELF EVIDENCE SURFACES (November 9, 2002). The graphing of these ELF signals in the ambient atmosphere under test include a plot of the frequencies, a data point view of these detected frequencies, and a trend analysis using a low frequency filter against the frequency plot.
ELECTROMAGNETIC SIGNATURE OF THE AEROSOL OPERATIONS

ELECTROMAGNETIC SIGNATURE OF THE AEROSOL OPERATIONS

Images of measurements of electromagnetic changes in the atmosphere made by Carnicom are presented here. There are indications in these images of increasing frequencies measured that correlate to the onset of aerosol operations. The images of the electromagnetic measurements include those made before, during, and after aerosol operations.