
THE BIGGEST CRIME OF ALL TIME
Clifford E Carnicom
Mar 01 2011
Note: I am not offering any medical advice or diagnosis with the presentation of this information. I am acting solely as an independent researcher providing the results of extended observation and analysis of unusual biological conditions that are evident. Each individual must work with their own health professional to establish any appropriate course of action and any health related comments in this paper are solely for informational purposes and they are from my own perspective.
It can now be shown with conviction that environmental filament samples and the filaments that are characteristic of the “Morgellons” condition are of one and the same nature. This has been demonstrated visually at the microscopic level on two prior occasions (please see An Environmental Source and The Breath of a Decade) but there has been a reluctance on the part of the general public to engage in the truths of this issue.
The case that they are of one and the same nature can and is also now being made analytically through the use of spectral analysis. This paper will progress through a series of spectral analyses that have been made, both on the control side as well as on the investigative side. The end conclusion that is reached from the work is that at least one source of the so-called “Morgellons” condition has been identified. The fact that this traces itself to a repeatedly occurring environmental sample represents, in my opinion, the worst crime in human history. There have been repeated attempts to have the full nature of these environmental samples disclosed for more than a decade but they have failed.
The primary party that is responsible for the failure of the identification and disclosure is the United States Environmental Protection Agency. The United States Centers For Disease Control and Prevention shares in the culpability of health neglect. The United States Air Force and the United States Congress share in the complicity of dismissal. I claim the right to speak honestly as I see appropriate.
The general public will at one point or another confront and reconcile with this reality, no matter how difficult the prospect will be. Progress in addressing the seriousness of the problem is not going to take place until this recognition by the public does take place. However unfortunate the task, this researcher will continue to put forth the evidence that forces this confrontation to the point of understanding.
Let us now proceed with the work that is to be described.
Through the course of the last year, a Beckman dual-beam spectrophotometer has been acquired under the auspices of the Carnicom Institute. It has been put to introductory use through the course of last year and familiarity with the capabilities and the principles of the instrument has been acquired. There remains a need for much additional equipment, a facility and a more contemporary version of the current spectrophotometer but some progress, nevertheless, has taken place. The current project involves the calibration of the spectrometer through a series of controlled studies and then the application of the instrument to unique and unidentified biological entities.
The Beckman model that has been acquired is rather elderly and it is based upon tube technology. All tubes have been replaced and control studies have been completed to give a reference point on the serviceability and the reliability of the instrument. These tests have been passed with sufficient confidence and the results of these tests will be presented first in this discussion.
The first problem is to acquire known spectral analyses and to see if the results can be duplicated with the equipment at hand. Spectral analysis is its own profession deserving of sufficient staff and resources, but the principles of operation and result are not so difficult that they cannot be understood by the majority of us. Levels of refinement in the process can continue as the understanding of the need for further support avails itself to the cause.
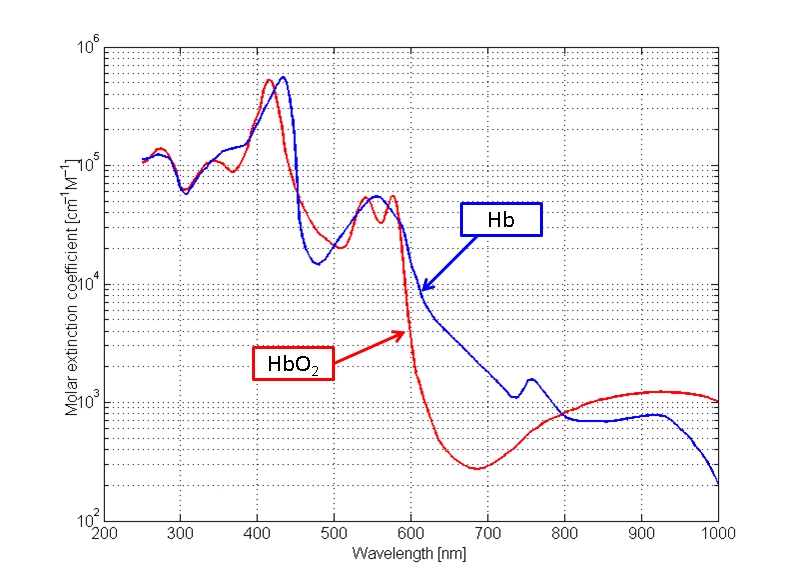
The first example chosen will be a spectral analysis of human blood, or hemoglobin as the case may be. This was one of the early studies in the application of the instrument and a level of confidence in those early results was achieved some time ago. Let us look at such a chart:
http://omlc.ogi.edu/spectra/hemoglobin/
A spectral analysis is essentially a fingerprint, or a unique signature, of a chemical substance or species within a particular range of frequencies. There are many ranges of energy that can be used if the required instrument and detectors are available; our particular interest here is in the range of visible light. The particular spectrum shown here from the reference designated above shows the absorbance of energy of hemoglobin (two variants, one combined with oxygen) as it is subjected to visible light energy; there is also some extension on each end into the ultraviolet and infrared portions of the spectrum. Visible light runs from approximately 400 to 700 nanometers in wavelength and it is represented along the horizontal axis of the graph. The Beckman instrument being used has a useful range of approximately 300 to 800 nanometers and that will be the band of comparison in the graphs that are presented.
Our main interest in the study at this time is the location of the peaks and troughs of the spectrum, as these locations are a key feature in establishing the unique signature of a particular species or substance. The magnitudes of the peaks and troughs (local maximums and minimums) can vary depending on concentration levels and is not our primary concern at this point; locations can also vary by the solvent involved. What we are looking for is a reasonable comparison between the minimums and maximums of a known substance in solution and that same substance in solution measured directly with the Beckman spectrophotometer. Some variations are to be allowed for, however, the locations of the maximums and minimums at specific wavelengths should compare reasonably well. Recall that we shall confine our examination to between 300 and 800 nanometers. For the graph above it is reasonable to use an average of the two graphs; our sampling methods do not allow for the distinction between pure hemoglobin and that combined with oxygen. At this point, we are simply attempting to establish a reasonable control on the reliability of the instrument that is being used.
In the control chart above, we see a minimum at approximately 310 nm, a maximum at approximately 420 nm, minimums at 480-505 nm, a maximum at approximately 550 nm and finally another low in the range of 700-750 nm. This provides us with several reference points to see if these inflection points can be reasonably reproduced.
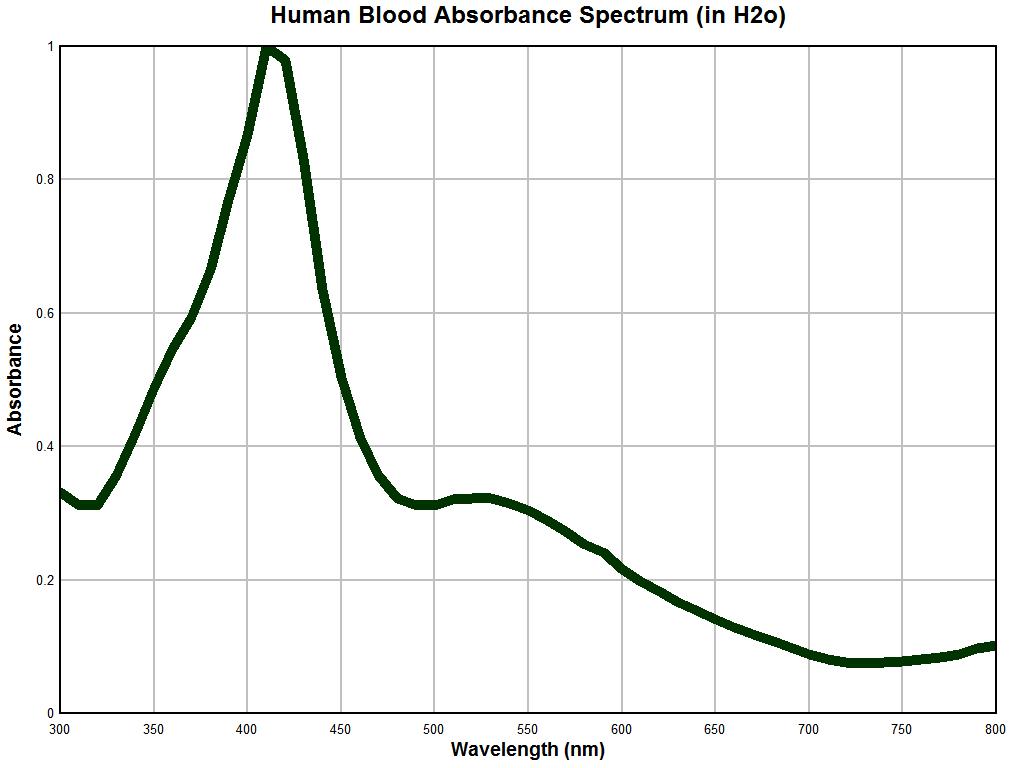
A graph of human blood in water obtained with the approximately 50 year old Beckman dual-beam spectrophotometer is shown above. This particular instrument has no automatic recording features, and all data must be observed by visually sampling meter readings at periodic intervals and then producing them on the graph above. In this case, the sampling has been done at 20 nm increments from 300 to 800 nm. Blood is a complex substance but we expect to see at least some reasonable concurrence in the data to continue the work further. Remembering that we are to dismiss magnitudes at this point and focus on the inflection points, we find a minimum at approximately 320 nm, a maximum at approximately 420 nm, a minimum at approximately 480 nm, a maximum at approximately 525 nm and a final minimum at approximately 725 nm. This indicates that we have in some reasonable fashion captured the characteristic signature of hemoglobin and that at this point there is no reason to doubt the integrity of the instrument.
It may be fair to presume that the resolution of detection within an older instrument is not expected to be the same as that of a modern instrument, but the locations of inflections should compare reasonably well. This has been achieved with the example above. It is also noticed that the varying light colors are easily and directly visible within the sample container of the instrument and that they correspond to the expected meter readings as the wavelengths are varied; this adds to the confidence in the instrument being used. A modern recording instrument would indeed be valuable but it is simply not available. Incidentally, dual beam spectrophotometers are considerably more complex but easier to use than single beam instruments, as they eliminate many of the variations that can occur with the swapping of a reference solution with the substance dissolved in another container of that same solution.
http://www.bjarke.com/upload/P1_done.pdf
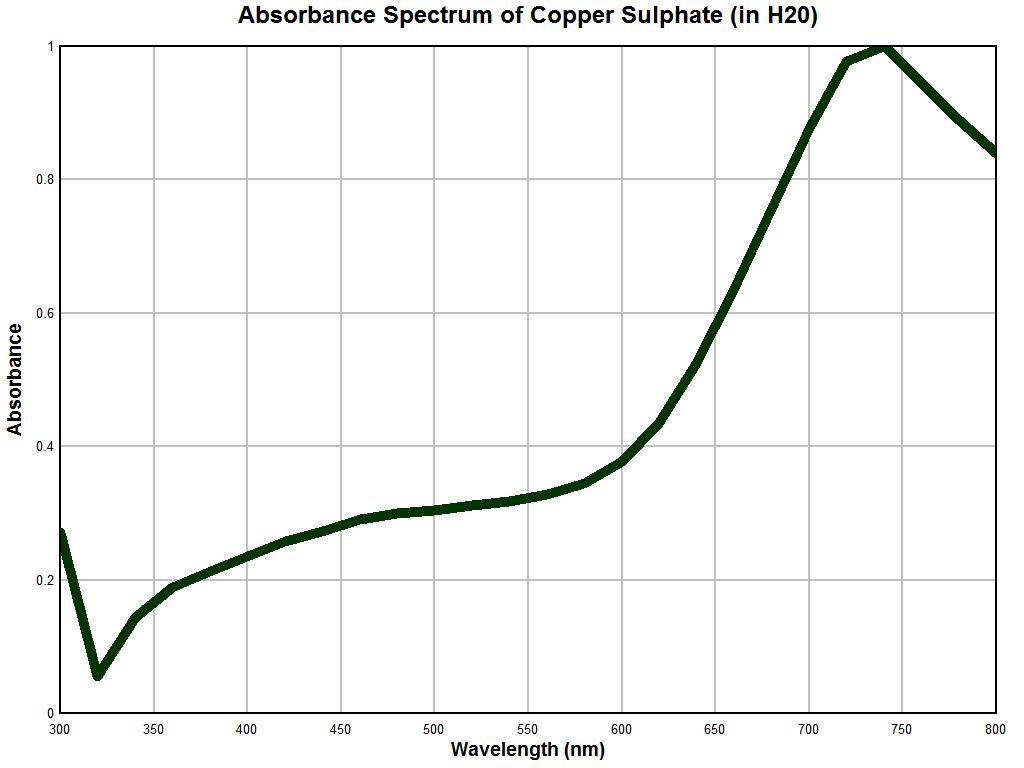
Our next example of a control test is that of a solution of copper sulphate (CuSO4); the graph above will serve as our reference. In the example above, the point is made that the concentration of the solution can directly affect the magnitude of the spectrum. The general shape of the characteristic curve remains generally consistent, however, we can see that the major peak at approximately 750 nm is not revealed until sufficient concentration exists. This is another reason that we must constrain ourselves to generalized interpretations of the spectrums at this point. More detailed instrumentation and constraints on the solutions will yield correspondingly more precise information for interpretation. Our objective here is simply to assure the reliability of the instrument being used for this report. The general features of this example are to notice a relatively sharp decrease in absorbance from the 300 to 400 nm range, a generally and relatively low and level absorbance in the range of 400 to 550 nm, a rather sharp increase in absorbance in the 600 to 800 nm range, and with sufficient concentration, a sharp local maximum at approximately 740-760 nm.
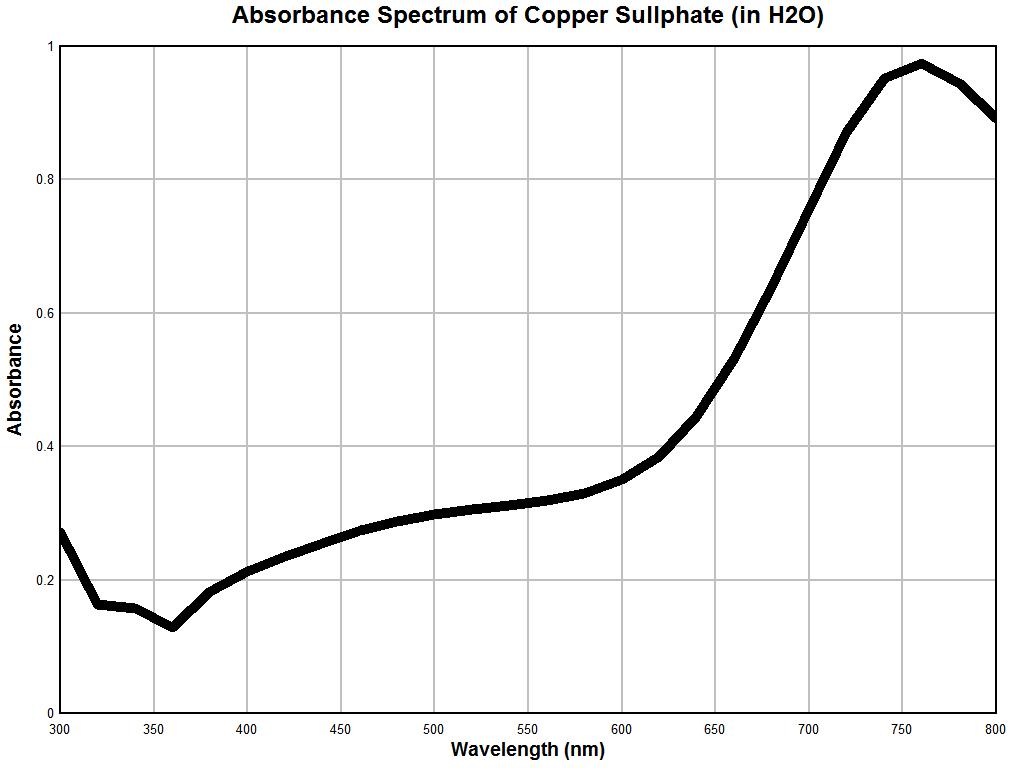
Above is the graph of solution of copper sulphate (concentration unknown) made with the Beckman dual-beam spectrophotometer. Once again, the general reliability of the instrumentation is established here. We notice a decrease in absorbance in the 300 to 360 nm range, a relatively modest to slightly increasing absorbance in the 400-600 nm range (mild increase in slope over the control sample, however), a sharp increase in absorbance over the 600-800 nm range, and a very pronounced maximum at approximately 750-760 nm. The more generalized resolution of the instrument on hand also remains apparent, but the uniqueness of the spectrum is once again established with reasonable confidence and reliability. A third control test was conducted using food dyes and the results again remain reasonable. It is at this point that we are sufficiently prepared to apply the spectral measurement instrumentation and techniques to an unknown substance. This will be discussed in the examples below.
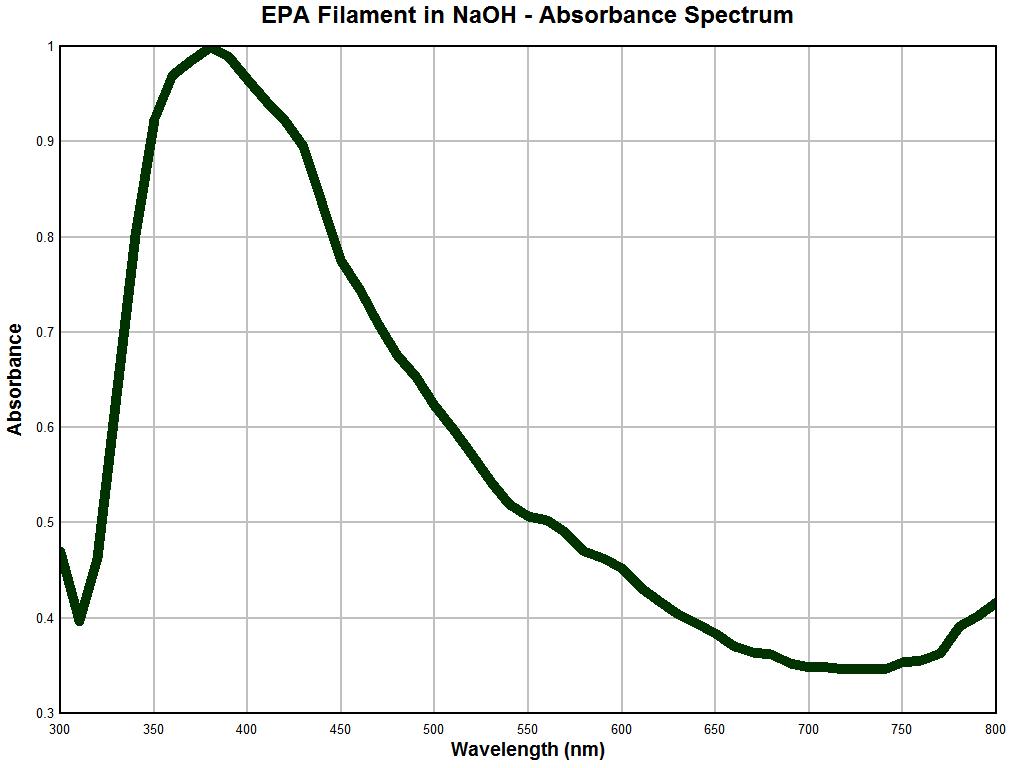
It is at this point that we begin to gain valuable new insight into a long standing problem. Above is a spectral analysis graph of an important and unique filament structure. The filament sample above is the same airborne environmental filament sample type that was sent to the United States Environmental Protection Agency. It was requested that the agency identify the nature of this filament structure on behalf of the public welfare and health interest. The agency refused to conduct this analysis and disclosure and stated that it was not their policy to do so. This filament structure has been described in detail on this site as it has been subjected to extensive microscopic analysis; please see the many reports in this site on this matter.
It has been learned from much testing that the exterior of the filament appears to be primarily an encasing structure and that it appears to consist of a keratin-like substance that is extremely resilient and difficult to penetrate or break down. Over recent years my focus has been on the internal nature of the filament as there are complex structures and biological developments that occur within. These observations have also been reported on extensively in this site. One of the most successful methods of penetrating the filament has been with the use of sodium hydroxide and heat; several experiments of that sort have been described.
The graph above shows a spectral analysis using primarily visible light wavelengths in a solution of sodium hydroxide after heat was applied; the sampling rate is 10 nm. The most salient features of this absorbance spectrum analysis include a very sharp peak at approximately 375 nm, a sharp increase prior to this maximum and a fairly sharp and steady decline in absorbance out to the end of the spectrum at 800 nm. As such, the spectrum is not inordinately complex but by nature it is unique and distinctive. This is, to my knowledge, the first time that this spectral information has been made available to the public using this particular analytical technique.
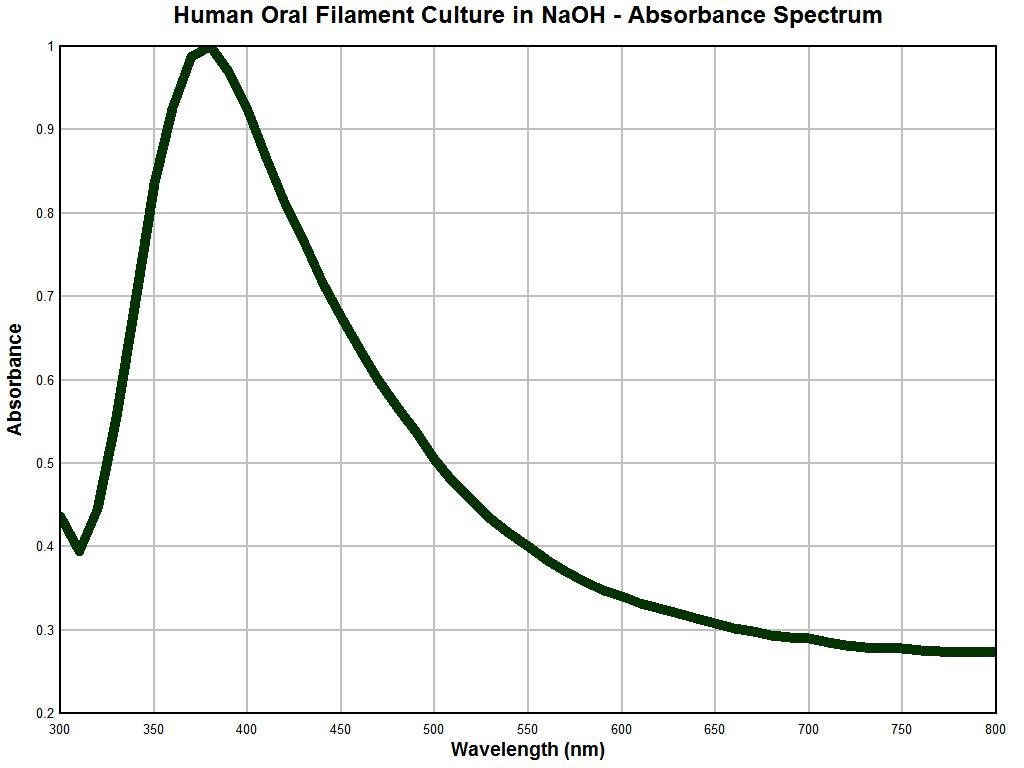
The graph immediately above is also remarkable for what becomes an obvious reason. The graph above is an absorbance spectral analysis of a culture that has been developed from human oral filament samples that are representative of, and characteristic of, the so-called “Morgellons” condition. The description of these cultures and the many microscopic examinations of these cultures have been presented throughout this site. This particular culture material is approximately one year old and was subject to drying and pulverization and it also was also placed into a sodium hydroxide solution with heat. The relative smoothness of this graph is likely due to the homogeneity that can be achieved in the preparation of this sample state. The biology of the organism appears to allow existence indefinitely in a dormant state if the environmental conditions demand it.
It is apparent that the latter two graphs are essentially identical. As the reliability of the instrument under use has been established with reasonable confidence, the following conclusion becomes evident: This conclusion is that the nature of a repeatedly occurring environmental filament sample is identical in nature to that filament entity which is representative and characteristic of the “Morgellons” condition. This equality in nature has now been established unequivocally through three different methods: visually, metrically, and analytically. There are potential therapeutic ramifications to the strong absorbance peak at approximately 375 nm and any strategies are to be treated with caution and respect; these will need to be developed in later reports.
As such, at least one source of the Morgellons condition has been identified and it is a repeating environmental source. It is now up to us as the inhabitants and stewards of this planet to comprehend the consequences and the significance of the conclusions herein.
Sincerely,
Clifford E Carnicom
Mar 1, 2011
