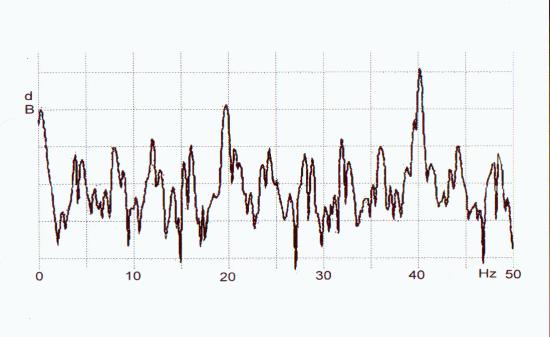
POSITIVE ELF SPECTRUM IDENTIFICATION
The spectrum of Extremely Low Frequency (ELF) signals has now been identified at multiples of 4Hz with the use of a digital spectrum analyzer/oscilloscope. The graph presented on this page was obtained with several significant modifications to the ELF circuit that has been described in the past few Carnicom papers, namely the paper titled ELF CIRCUIT DESIGN (dated January 26, 2003) with modifications that are discussed here and will be described further in a future paper. It was observed that the power of the signal being received is clearly of artificial origin and occurs at multiples of 4Hz. These frequencies occur in the range of the primary electromagnetic activity of the human brain.
Research is currently underway to determine the direction (and eventual location) of the signals that are being generated and to which the populace is subject. Additional information on the directional parallel resonant loop antenna and the additional amplifier circuit will be forthcoming.
It is requested that citizens across the nation and/or globe construct the circuit as it has been developed to assist in determining the origin of the signals through triangulation. Modifications for further enhancement are also welcomed.