

CONTRAIL DISTANCE
FORMATION MODEL
Clifford E Carnicom
Mar 22 2001
Edited Dec 19 2014
Edited Jun 01 2016
A model has been developed to estimate the distance behind the engines that a contrail, i.e., condensed trail of water vapor, is expected to form. The results of this model agree exceptionally well with a statement issued by the United States Air Force that “contrails become visible roughly about a wingspan distance behind the aircraft”. There is now an abundance of photographic and video evidence that consistently and visibly demonstrates the repeated formation of aerosol trails in much closer proximity to the engines than that which is established by the Air Force, as well as that which is predicted from the model described below. These trail formations are in direct contradiction to a statement of fact issued by the United States Air Force. This evaluation now adds to the multitude of studies which conclusively demonstrate that the emissions from these aerosol operations are not composed primarily of water vapor. This model is not intended to encompass all variables that may be in effect, but does represent a rational attempt to model the physics of contrail formation times involved. Any corrections to this study will be made as is appropriate. This model is in addition to that previously developed related to expected contrail dissipation times, as well as originating relative humidity studies at flight altitude.
The model is developed as follows:
Let us assume that the temperature of the exhaust emissions of the aircraft is approximately 1000 deg. C., which is an apparent reasonable estimate (see Principles of Jet Engine Operation). The model can easily be generalized to encompass any reasonable ranges in temperature that are expected within the combustion process and subsequent exhaust emissions. The model is not highly sensitive to expected changes in temperature at this level, and if a more accurate value becomes available, it will be used in the future.
Let us assume the temperature of the atmosphere at flight altitude, approximately 35,000 ft. MSL is -50 deg. C. Again, each variable within the model can be generalized as needed, and the sensitivity of the model to these changes can be evaluated.
The amount of heat extraction required to cool the exhaust vapor can be given as follows:
H = dH(ice) + dH(melting) + dH(water) + dH(vap) + dH(steam)
for the sake of initial example and simplicity, and to demonstrate numerical results, let us apply this to 1 gram of water:
-H = (1 gm) (.5 cal / (gm * K) ) ( 50 deg. K )
+ (1 gm) (80 cal / gm )
+ (1 gm) (1.0 cal / (gm * K) ) (100 deg. K )
+ (1 gm) ( 540 cal / gm )
+ (1 gm) ( .33 cal / gm ) * 900 deg. K)
or
H = -(25 + 80 + 100 + 540 + 300) cal. = -1045 cal. required to cool steam at 1000 deg. C. to 1 gm of ice at -50 deg. C.
Now,
1 calorie (cal) = 4.1868 Joules (J)
Therefore,
-1045 cal = -4375 J.
Next, to consider a realistic particle size for emissions from aircraft, the Max Planck Institute has stated that the average size of particles emitted from aircraft is approximately 30 to 200 microns in size. As a side note, the average particle size of cloud nuclei is stated by Vincent Schaefer, Atmosphere, to be from 0.2 to 0.3 microns. Let us assume an average size of 115 microns on each side of a cube particle.
Since 1 gm. of water = 1 cu. cm in volume, a cube particle size of 115 microns in dimension on each side has a volume of:
(115E-6)^3 meters, or 1.52E-12 cu. m.
Since 1 gm. of water has a volume of (1E-2)^3 meters, the volume of a gram of water is (1E-6) cu. m.
The ratio in volume of a particle of dimension 115 microns to a gram of water is:
1.52E-12 cu. m. / 1 E-6 cu. m
or
(1.52E-6)
The amount of heat required to cool the 115 micron particle is therefore
(1.52E-6) (4375 J) = 6.654E-3 J. for a particle 115 microns thick and corresponding to a temperature change of 1050 deg. C. [note units are therefore: J / (m * K)]
Now evaluate the thermal conductivity of the medium in which the particle exists, i.e., air. From the REA Handbook of Mathematical, Scientific, and Engineering Formulas, Tables, Functions, Graphs, and Transforms, the thermal conductivity of air at – 50deg. C. is given as .012 Btu / (hr * ft * deg. F).
Converting this value to SI units,
.012 Btu / (hr * ft * deg F.) -> (1055 J / Btu) / ((3600sec/hr) * (.3048m/ft.) * ((5/9)deg. K / deg. F))
or the thermal conductivity of air at a temperature of -50 deg. C can be given as
.02075 J / (s * m * K)
Therefore the amount of time required to cool the particle from 1000 deg. C to -50 deg. C is given by:
(6.654E-3 J / (m * K)) / (.02075 J / (s * m * K)) = .321 seconds.
Now for an aircraft traveling at 500 mph, this translates to approx. 733 ft./sec.
Therefore, the particle evaluated will cool to the ambient temperature in approximately:
(733 ft./sec) * .321 sec = 235 feet behind the engines of the aircraft.
A Boeing 757 measures approximately 155 ft. in length. The distance from the rear of the engines to the tail of the aircraft is approximately 80 feet (scaled). Therefore the contrail is expected to form approximately (235 ft. – 80 ft.), or approximately 155 ft. behind the tail of the aircraft. The wingspan of a Boeing 757, being used as a representative example, is approximately 125 feet in width. The results of this model agree quite well (approx. 30 ft. coupled with the transition zone) therefore, with the expected physics and chemistry of water vapor as well as with the statement provided by the United States Air Force. The model will show itself to be sensitive to particle size. “Contrail” formation in front of, or immediately adjacent to the stabilizer region of the aircraft, is not to be expected either from the results of this model, or from that statement issued by the Air Force.
Significant deviations from these results as well as from the USAF statement, as they occur repeatedly in conjunction with the aerosol operations, are tangible evidence of non-water vapor emissions that are involved.
Clifford E Carnicom
Mar 22 2001
Additional Note ( Dec 19 2014):
Correspondence regarding this paper of 2001 has been received by me directly for the first time during the current week. I will review this paper that was written more than a decade ago as time and circumstances permit; I estimate that this will take place within the next month of two from this postscript. I am currently involved with active projects that require my attention and efforts. In the interim, and in the spirit of open disclosure and fair consideration, the correspondence received is linked immediately below.
Correspondence received on the week of Dec 19 2014.
On the first pass to attempt to access the information referred to, the following error is encountered on both sources (as is forewarned in the correspondence). This information will be required to evaluate the matter further.

It appears that the information will originate from the following source:
Institute of Atmospheric Physics
Clifford E Carncom
Dec 19 2014
Additional Note ( Jun 01 2016):
The link referenced in the correspondence is operational as of this date, and I have reviewed the material. The issue here appears to be a classic case of using the logic fallacy of “the exception proves the rule”. If the material is reviewed with respect to its entirety and context, it will be seen that the model and statements referred to within the correspondence are in direct agreement with the model presented in this paper. As provided:
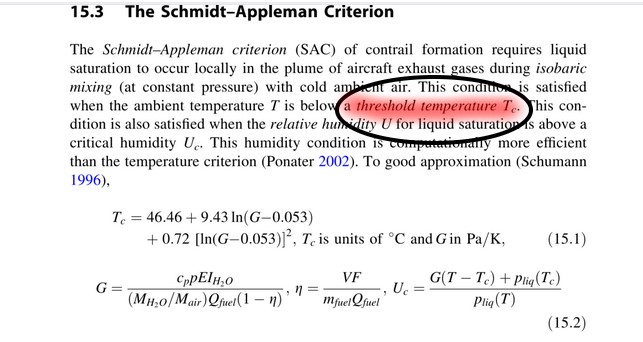
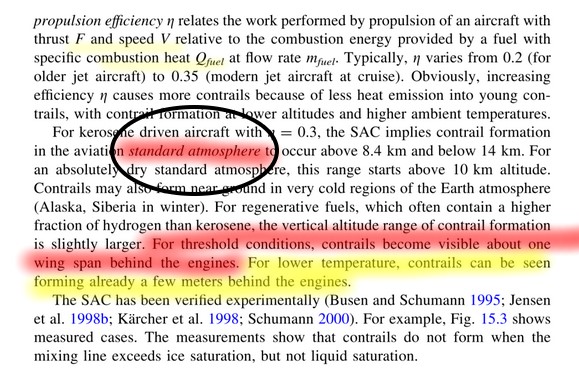
If the section is read in its entirety, the following points are clear.
- The standard atmosphere is chosen as the reference. This is fitting and proper as it is the most comprehensive model of atmospheric conditions that exists for physical reference on the state of the atmosphere.
- The “threshold temperature” is the critical temperature of formation for the contrail , and it is a primary focus for creation of the model to begin with.
- Under standard atmospheric conditions and under the threshold conditions, i.e., exactly the conditions of research for all models (Carnicom , Schmidt-Applebaum and the U.S.Air Force) the conclusion is exactly the same. Approximately one wingspan behind the aircraft is the norm of formation for the contrail under standard atmospheric conditions.
- The model then provides the exception that under “lower” temperatures (i.e., NOT standard), the distance of formation “can” be less. This is the exception to the norm, and it is always reasonable in model formation to allow for exceptions. The temperature magnitudes for the exception case are not defined, as it is fair to assume that they are anomalous and outside the range of normal modeling. Exceptions are not the norm, and cannot be claimed to account for the norm. This fallacy of logic denies the value, purpose and objective of the modeling process itself.
- The paper stands as written.
Clifford E Carnicom
Jun 01, 2016
