A LEADING CAUSE OF DEATH

A LEADING CAUSE OF DEATH

The mortality statistics in the US for 1999 have been released by the Centers for Disease Control (CDC) on June 26, 2001. The results of this report beg these questions (and others): 1)Why is one of the 5 leading causes of death no “Chronic lower respiratory disease”? 2)Why was the former leading death category “Chronic obstructive pulmonary diseases and allied conditions” changed for the 1999 data to now read “Chronic lower respiratory disease”? Included here are pictures of HEPA filters from a house air filter showing particulates and matter on the filters.
AEROSOL TRACKING RADAR RESEARCH

AEROSOL TRACKING RADAR RESEARCH

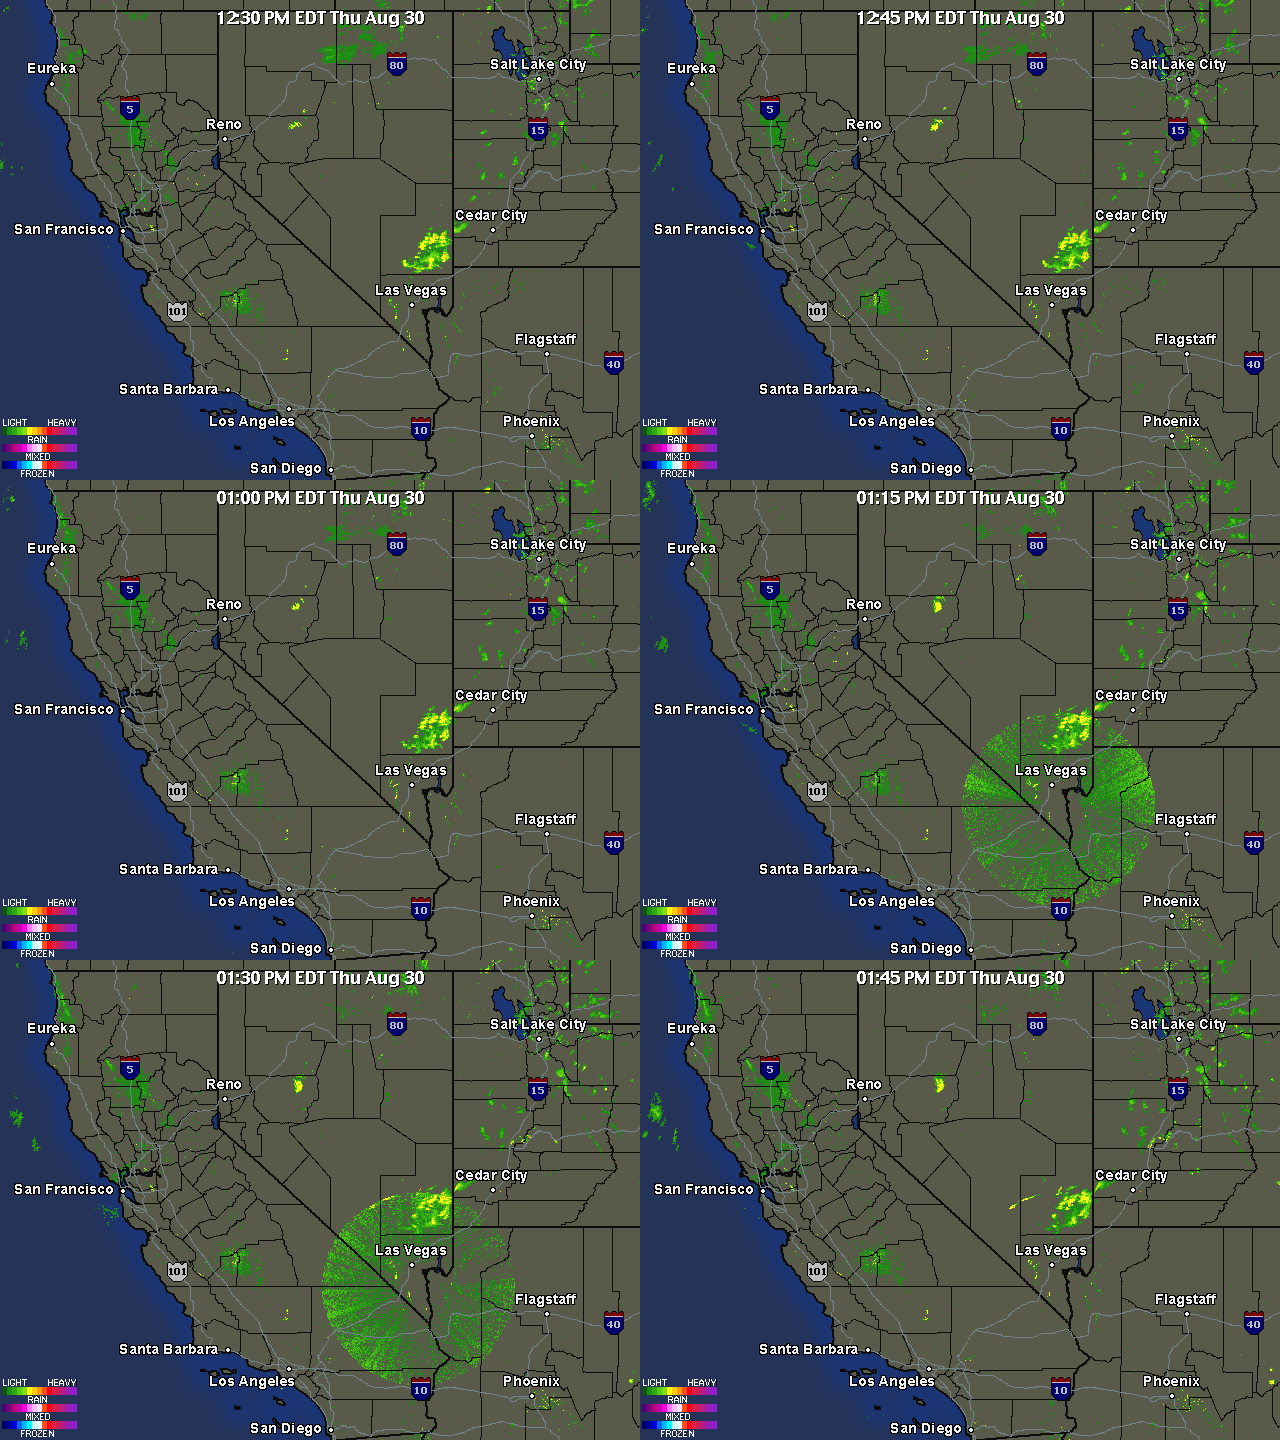
This page shows a radar image from August 30, 2001 of an area of the southwest US, with an anomalous extensive circular and stationary return just southeast of Las Vegas, Nevada. Citizens are urged to devote increased attention to such images that have been monitored and reported in conjunction with aerosol operations that are in progress all over the globe.
NATIONAL & GLOBAL NOTICE GIVEN

NATIONAL & GLOBAL NOTICE GIVEN

Informational packets containing research data by Clifford Carnicom have been put together and mailed to a long list of recipients, including politicians, biologists, university heads, the US Surgeon General, and other federal law enforcement officers. The contents of the information packets and the list of those they have been sent to are listed here.
AIR QUALITY DATA REQUIRES PUBLIC SCRUTINY

AIR QUALITY DATA REQUIRES PUBLIC SCRUTINY

A case is made here for the need to have independent testing and verification performed of current atmospheric particulate counts in the United States. The basis for such a need includes; the repeated observations of the decline in visibility in the US (which is directly related to particulate concentrations), the unwillingness of the US Environmental Protection Agency (EPA) to adequately address concerns of countless citizens regarding atmospheric degradation by aircraft aerosol operations; the US National Weather Service’s reduction of visibility reporting standards from a maximum of 40 miles to a maximum of 10 miles; the apparent limitations of access to post-1998 public data base files that involves direct atmospheric monitoring by government bodies such as NOAA’s Climate Monitoring and Diagnostics Laboratory; and the newly released 1999 US mortality statistics showing an increase in chronic lower respiratory deaths. A theory of light scattering is discussed to be used as an initial estimator of atmospheric concentrations of particulate data, with example cases used to illustrate how such models can be used to estimate these
RAINWATER SAMPLES: MICROSCOPE VIEWS (II)

RAINWATER SAMPLES: MICROSCOPE VIEWS (II)

More photographs of rainwater concentrate as viewed under a microscope are presented here as a complement to investigations recently presented on the Carnicom.com website (see previous RAINWATER METALS, CRYSTAL CHEMISTRY, and RAINWATER SAMPLES: MICROSCOPE VIEWS papers). These photographs depict primarily a log of recurring structures which are found under various conditions, rather than an analysis of such structures. These structures in these microscope pictures appear to be fibers, metal oxides, and other unidentified materials. All citizens are urged to participate in the process of further collection of rainfall samples, subsequent distillation or concentration and the identification of material substances within. Any assistance provided by other researchers or sources is welcome.
RAINWATER METALS: MICROSCOPE VIEWS

RAINWATER METALS: MICROSCOPE VIEWS

Photographs of rainwater concentrate as viewed under a microscope are presented here as a complement to investigations recently presented on the Carnicom.com website. These photographs depict as evaporated crystalline form as well as a wet slide mount of the samples. The materials in these samples under microscope appear to be composed of several distinctive and complex forms, with the dominant material being a metal oxide. The presence of fibrous materials, measuring approximately 1-2 microns diameter, occurs frequently and is easily visible within the wet slide mount pictures.
RAINWATER METALS

RAINWATER METALS

Rainwater sample analysis is showing extraordinary levels of metallic particulates in these samples. A sample is presented here from rainwater collected on July 26, 2001 in Santa Fe, New Mexico. Distillation of the rainwater sample has been used so as to make the metallic particulates visible to the naked eye in test tubes. The pH of these rainwater samples has recently been measured at 7.6 or higher, demonstrating a level of alkalinity much higher than that expected in rainwater.
TWO SUBMITTALS: MEGASPRAYER – SATELLITE PHOTO

TWO SUBMITTALS: MEGASPRAYER – SATELLITE PHOTO

Two more photos were submitted to Carnicom.com by a concerned citizen. The first shows a Megasprayer spraying aerosols taken on July 5 2001 at 9AM in Diamond Springs, CA. The second photograph is a satellite image showing very clear, obvious and heavy aerosol lines off the coast of California on July 24, 2001.
CRYSTAL CHEMISTRY

CRYSTAL CHEMISTRY

Recent results from examining rainfall samples using methods of crystal chemistry are indicating substantial levels of metallic particulates within these rainwater samples. The analysis of the aerosol operations by a combination of methods repeatedly results in considerable attention being given to the elements of Group II of the periodic table (e.g. – magnesium, calcium, barium). The crystalline forms primarily found in these rainwater samples and documented with microscopic pictures is that believed to be magnesium chloride. This gives an indication of the existence of ionic magnesium within the rainfall sample. A description of the method used to create the crystalline forms shown in the attached pictures is provided here, with discussion of the polarizability and deliquessence attributes of these samples.
ATMOSPHERIC CONDUCTIVITY

ATMOSPHERIC CONDUCTIVITY

Research is indicating that the conductivity of the atmosphere has been increased in conjunction with the extensive aerosol operations that have been documented. This paper details using a Van de Graaf generator to create a spark in the open atmosphere to determine the dielectric strength (or conductivity) of the atmosphere. The conclusion after testing was performed is that the atmosphere is not acting as efficiently as an insulator, or conversely, the atmosphere is more electrically conductive than is expected, indicating that conductivity characteristics of the atmosphere have been altered.